Mine have always been a bit functional, and I’m curious what more creative people have achieved.
Anyone fancy showing off what they’ve put together? Feel free to blank out personal information, obviously.
And on another note, I’m now moderating this sub. Hi!
Let me know if there is anything you’d like to see added to the sidebar, I’m aiming to update it over the next few days.
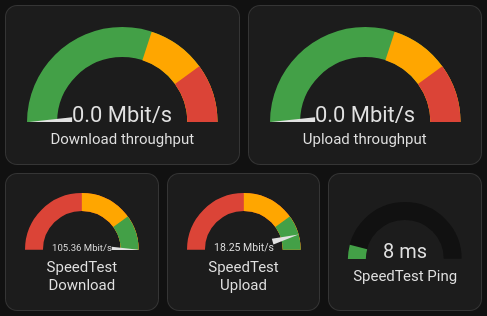
My “What’s the internet connection up to?” card:

My “Leaving the house” card:

It’s nice to compare the local predicted temperature, and local sensor.I’m glad I glanced in here. I recently deleted everything and had to start again, but MET office was broken on my old install so I never tried again.
Your screenshots made me reinstall, and my phone remembered my Met office logins (bonus) so it took seconds. And it works!
It was broken for a few weeks of 2024.2 (I think). I ended up learning how to do a manual downgrade while they fixed it!
What did you use to get the information for the current internet throughput?
It’s pulled from my main router using it’s metric for it. It only updates once a minute or so, but it’s a nice metric.
Once I switch over to more powerful gear, I’ll probably have to start using SNMP, which I don’t look forward to!
Drive time to work is a great idea!
Currently, it’s using a Waze integration.
The coolest thing, is that it’s given me a really nice data set for when are the bad times to drive across town are. (Sadly, it’s during the morning and afternoon school runs).
It also reveals that the travel time on average is impacted significantly by the school holidays, and the weather.
Ooooooo bby.

I have this one on a wall mounted tablet.
- Left column:
- time and date
- solar battery level
- car battery level
- solar production vs. load
- camera of the entrance
- Middle column:
- current weather as measured by my weather station
- forcast for today
- list of open windows and doors
- (not shown) any emergency warnings (storms, etc)
- scheduled garbage collection for the different recycling types
- Right column
- warm water boiler control (override for the automation which turns it on only in the morning)
- current temperature in the boiler
- turn on/off the car charger (until I come around to automate it)
- List of devices that need their battery replaced
- rain radar
These are the most important values to be shown in the hallway. There are other dashboards for other situations…
- Left column:


